


C&RT's canal closure figures don't hold water
September 2018 - Just over two weeks ago, The Floater published an article which said: ‘Asked to explain discrepancies within its own figures on canal closures, Canal and River Trust’s head of legal services [Tom Deards] claimed answering the questions, from The Floater’s Allan Richards, would cause: “harassment of, or distress to, the public authorities staff'. He added 'We do reserve the right to bring this behaviour to the attention of the relevant authorities for the purposes of the Protection from Harassment Act 1997.’
While the threats continue, Allan has found another route to some of the information he has been seeking
In the article, The Floater quoted C&RT’s latest annual report as follows ‘Notwithstanding our rising core expenditure and our improving application of the principles of long term asset management as our asset strategy evolves, the considerable age of our infrastructure, much over two centuries old, means that we do suffer significant asset failures that require immediate intervention. Lock 15 on the Peak Forest Canal’s Marple flight had to be closed in September 2017 after a lock wall was found to have moved such that the lock had become un-usable. This was a significant factor in us missing our target on unplanned closures in the year, (with 490 days lost against the target of 400, though this remains a significant improvement since the Trust was created).'
However, Allan Richards speculated ‘ ... the number of navigational closures monitored over an eight week period has never fallen below 11. If this were extrapolated over a year then it would equate to over 4,000 days of closure. Even if we took out the five months of winter works with all its planed closures we would still be left with a figure of over well over 2,000 navigation closure days. This is four or even five times higher than the figure given in the annual report.’
Allan now tells us that, having found a way to interrogate the C&RT stoppage database and get historical information, he can now replace speculation with fact.
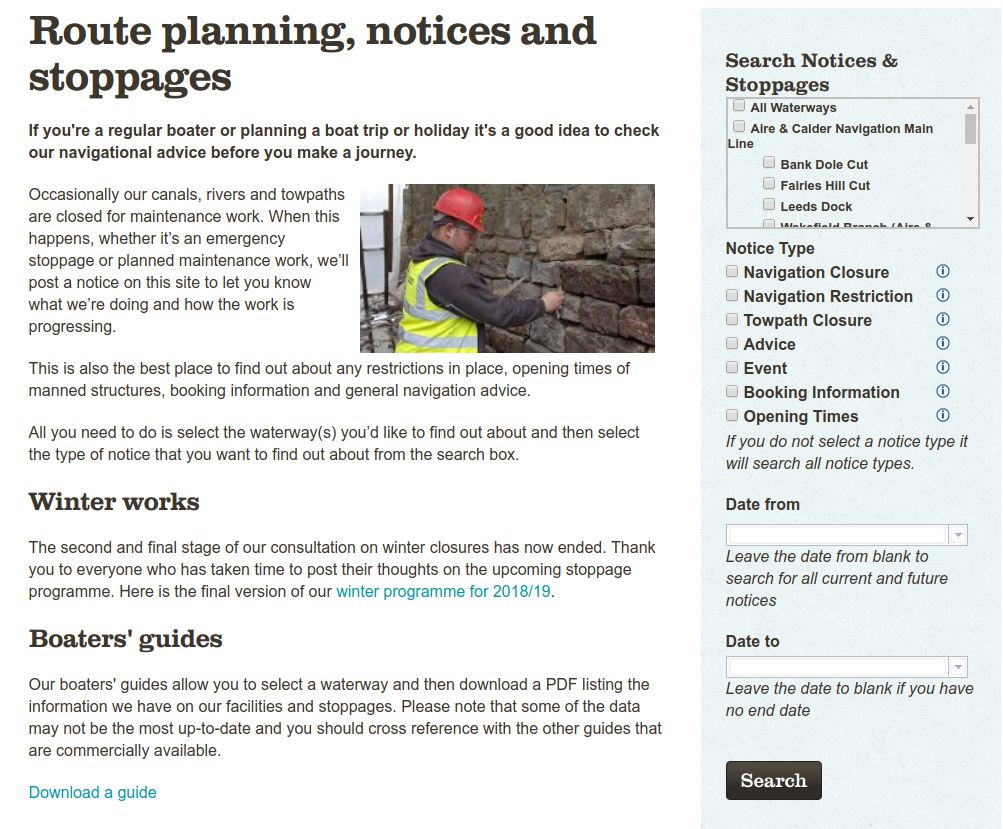
C&RT’s stoppage database is publicly available. Anyone can run enquiries on it by filling on a form on a web page. C&RT makes the assumption that those using it are only interested in current or future information and will alter enquiries such that information prior to ‘today’ can not be retrieved.
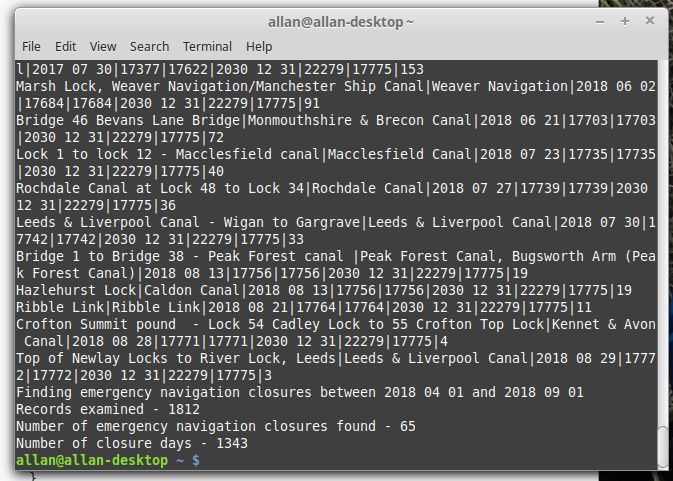
However, a way has been found to interrogate the stoppage database such that all records can be examined. A program has been written which simulates a user making an enquiry. It bypasses attempts to prevent information prior to ‘today’ being returned. and is able to calculate the number of stoppages between two dates as well as the number of ‘lost days’ due to stoppages.
The screenshot shows part of the output from the program. In this case the program is calculating the number of emergency navigation closures and closure days for the first five months of this financial year (April - August 2018).
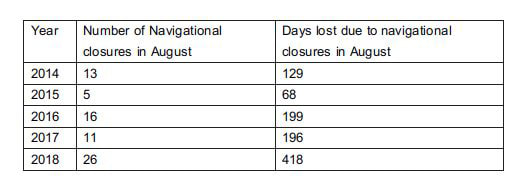
Here is the output from the program for the month of August for each of the five years from 2014 to 2018.
Over a five year period number of closures in August has doubled. The days lost to closures has more than tripled.
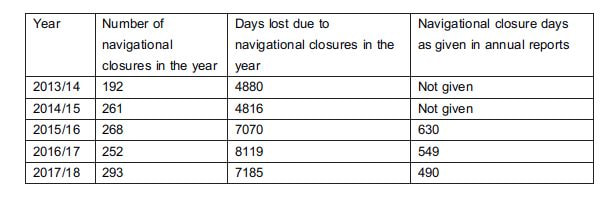
Turning to yearly figures, here is what the program gives us, (C&RT’s published figures are given in the right column for comparison) -
However, these figures include ‘planned winter navigation closures’ as well as for ‘emergency navigation closures’ as they are both ‘navigation closures’.
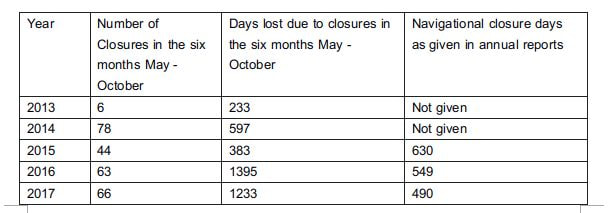
Whilst it is thought that, with some effort, the program could be adapted in future to split ‘navigation closures’ into ‘planned’ and ‘emergency’, as an interim it has been used produce closure figures for the six months between May and October each year when the vast majority of closures are ‘emergency’ (i.e. outside the winter works period) -
Yet again, an upward trend in both closures and days lost. This despite C&RT’s claim that they are reducing unplanned navigational closures.
Here again is what C&RT claimed in its last annual report ‘This was a significant factor [i.e. the first Marple closure] in us missing our target on unplanned closures in the year, (with 490 days lost against the target of 400, though this remains a significant improvement since the Trust was created.’
However, interrogation of C&RT’s stoppages database suggests the exact opposite - a significant deterioration!
... and with the stoppage database already showing 1343 days lost to emergency navigation closures for the first five months of this this financial year (i.e. April 2018 - August 2018) the upward trend appears to be set to continue.
At face value, once again C&RT has been caught out attempting to mislead the public. Perhaps little wonder that they make threats to avoid answering questions ...
Read the original article here: C&RT ISSUES THREATS TO AVOID ANSWERING QUESTIONS.
Photos: (1st) C&RT’s stoppage database is publicly available, (2nd) The number of emergency navigation closures and closure days for the first five months, (3rd) The month of August for each of the five years, (4th) Yearly figures, (5th) An upward trend in both closures and days lost.