


NUMBERS OF VISITORS ARE NOW FALLING

July 2018 - Just at the time when C&RT’s whole future is balanced on it being able to show it improves the well-being of more and more non-boating canal visitors there is a distinct downward trend in numbers visiting the system, as Allan Richards has discovered.
Last December, The Floater announced that C&RT had acknowledged that it would miss its 2016/17 target for the recruitment of Friends and that some other targets, including visitor numbers were in danger of not being met. In March, we found that C&RT had acknowledged that it would miss a further five targets, including that for visitor numbers.
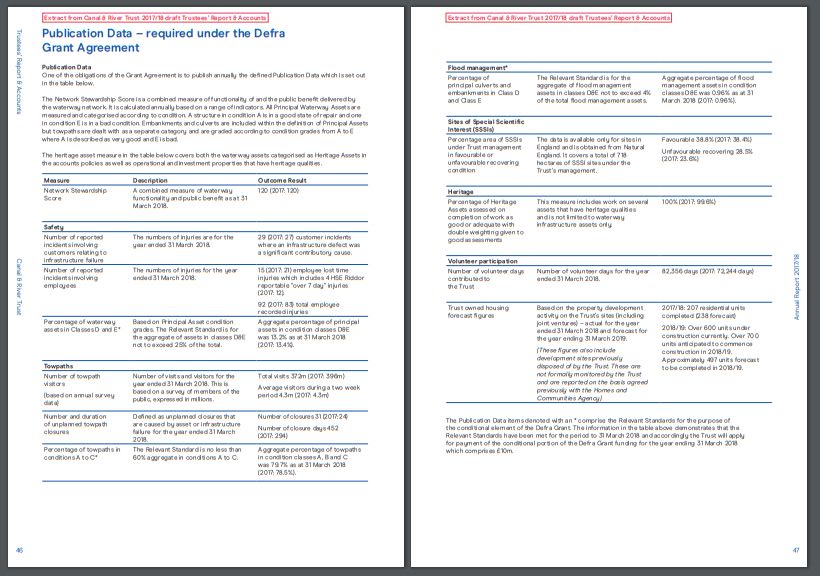
C&RT’s grant agreement with Defra requires that it provides ‘publication data’ ahead of its annual report. That data, which has been published in the last few days, confirms that the public is visiting the trusts waterways less often. Over the last three years, instead of increasing visits, the number of visits has dropped by 7.5%. Allan Richards takes a look at the visitor figures and asks if C&RT has given up trying to halt the decline.
C&RT uses a Key Performance Indicator (KPI) measure of ‘Number of Individual visitors to our waterways in a typical two week period (over last 12 months)’. This figure is taken from a survey which initially asks if a person has visited a waterway in the last two weeks. Information gathered also allows the number of individual visitors over a year to be estimated and the total number of visits (a visitor may visit more than once).
With the provision of ‘publication data’ a couple of days ago we are now able to not only compare C&RT’s KPI performance against target year on year but also the total number of visits.
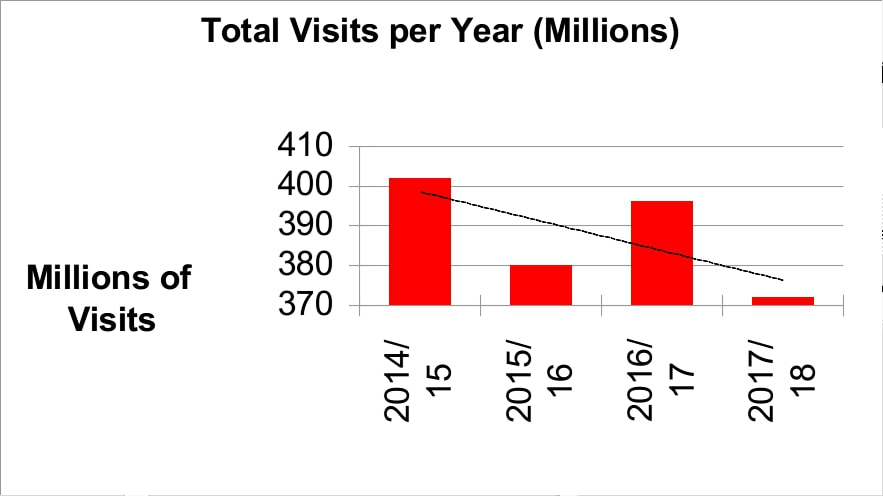
Two charts have been prepared based on information contained in annual reports, publication data and board papers. The first is based on ‘publication data’ - the information C&RT is required to provide as part of its grant agreement with Defra. The black ‘trend line’ shows that visits to C&RT’s waterways have declined by 7.5% since 2014/15 - down from 402,000,000 to 372,000,000.
The second chart shows how C&RT’s measure against its KPI is also falling - a 4.5% decline over three years. More importantly, perhaps, C&RT’s 2017/18 ‘actual’ figure is some 9.5% below the 2016/17 target figure!
Are visitor numbers important? You bet! Under Robin Evans and Tony Hales, British Waterways set out to double its visitors over a ten year period (ending 2012) from 3.6 million to 7.2 million per average two week period. The reason for this is government can equate visits with public benefit - the more visits the more public benefit. Double the visits doubles the public benefit ...
It has to be said that the best British Waterway achieved (including Scotland) was 4.3m in 2009/10. That is exactly the same as C&RT’s figure some eight years later!
With C&RT now suffering a decline in visitor numbers it is difficult to see how they might reverse this and attract 7.2m visitors to its waterways by 2027 when government funding runs out. Even if they do so it will be 15 years later than British Waterways aspirational 7.2m by 2012.
Bearing in mind C&RT’s re-branding as a wellbeing charity, the figure of 402 million visits per year in 2014/15 equates to 550 people visiting each mile of waterway each day to have ‘wellbeing’ improved. Obviously the re-branding has been successful as, in 2017/18, only 510 needed to visit each mile of waterway each day. The other 40 have, no doubt, have wellbeing increased so much that they no longer need to visit!
Photos: (1st) Average visitors in a two week period, (2nd) Total visits per year, (3rd) Publication data.