


More lock gates than ever? .. not really
August 2017 - One of C&RT's claims when it launched its Annual Report last month was that 2016/17 included its biggest ever programme of lock gate replacements. Allan Richards digs out the facts and comes to the conclusion that, once again, the Trust's claims are not supported by the facts.
Worse still, it appears that the Trust has misled on the number of gates it produces and installs and falls far short of the requirement to replace gates every 25 years.
Perhaps the best overview of the need to replace lock gates is given in C&RT's 'Water Resources Strategy 2015-2020'. This document was launched in late 2015 and was titled 'Putting the water into waterways'.
The document states that there are nearly 1,600 locks across the network. It says 'Lock leakage, and in particular, lock gate replacement is addressed in the Trust’s Asset Inspection Procedures. At present, lock gates are assessed separately from the primary lock asset as their lifespan is much shorter than the lock itself.'
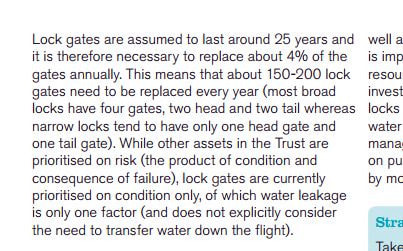
It continues 'Lock gates are assumed to last around 25 years and it is therefore necessary to replace about four per cent of the gates annually. This means that about 150-200 lock gates need to be replaced every year (most broad locks have four gates, two head and two tail whereas narrow locks tend to have only one head gate and one tail gate). While other assets in the Trust are prioritised on risk (the product of condition and consequence of failure), lock gates are currently prioritised on condition only, of which water leakage is only one factor (and does not explicitly consider the need to transfer water down the flight).'
Most experienced boaters will have noted that the report's author believes that most single locks only have a single tail gate which is not true. Whilst broad locks will have four gates, narrow locks have two or three. However, the important point is that lock gates have an average life expectancy of 25 years.
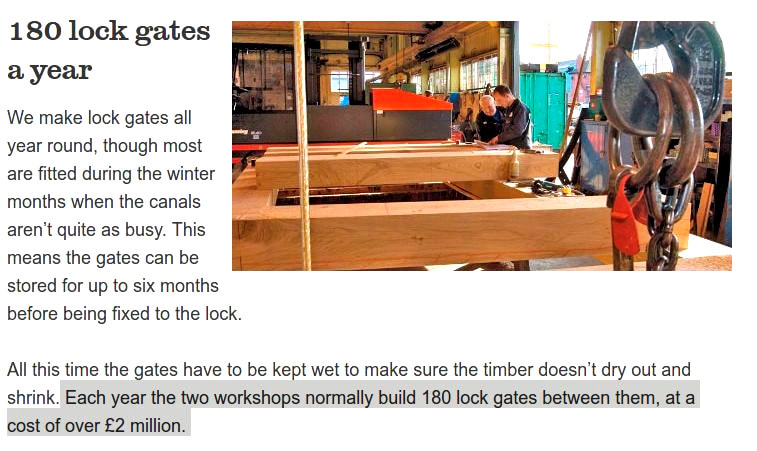
Turning to C&RT's web site, its 'building lock gates' web page agrees with the life expectancy of a lock gate: 'An average lock gate lasts for about 25 years.' Under a sub-heading of '180 lock gates a year' the webpage states 'Each year the two workshops normally build 180 lock gates between them, at a cost of over £2 million.'
Pleasingly, the 180 per year on the web page falls neatly between the 150-200 given in the 'Water Resources Strategy' document. So there you have it - 180 per year over the first five years of the Trust. That's 900 gates!
Unfortunately, the 180 per year claim is a complete fabrication. The Trust has confirmed that, in its first five years, it installed just 755 gates. Here are the figures:
2012/13 166
2013/14 130
2014/15 140
2015/16 159
2016/17 160
==========
Total 755 (Average 151 per year)
So C&RT's claim that it normally builds 180 per year is false (even allowing for the fact that it very occasionally manufactures for other navigation authorities). The actual average over the first five years is 151. Worse still, the webpage was last changed in November 2015. As such, only the first three years figures should be taken into account. The average for the first three years is just 145 gates rather than 151 or 180.
Returning to C&RT's claim that 2016/17 included its biggest ever programme of lock gate replacements, from the above it can be seen that this is not true. Whilst C&RT did install one more lock gate than the previous year, it installed less than in the first year of its operation.
With C&RT attempting to put spin on its lock gate replacement program, one is left wondering if it is actually replacing four per cent of its gates every year. Whilst we do have a figure for the number of locks - 1589 - what we don't have is a figure for the number of gates as the head and tail of locks can have a single gate or a mitred pair which would be replaced together.
1589 locks means 3178 head and tail sets - a set comprising of one or two gate leaves. C&RT says it needs to replace 4 per cent of these each year. That's about 127 head or tail sets per year. Here are the head/tail set figures provided by C&RT for the last five years -
2012/13 100
2013/14 75
2014/15 81
2015/16 88
2016/17 97
==========
Total 441 (Average 88 per year)
To sum up C&RT claims that 2016/17 included its biggest ever programme of lock gate replacements. This is untrue - more lock gate replacements took place in 2012/13.
C&RT also maintains that the average life expectancy of lock gates is 25 years. As such it needs to replace four per cent of gates per year. This equates to 127 head or tail sets per year.
However, the replacement program is only achieving an average of 88 per year. This is less than 70 per cent of what C&RT say is needed!
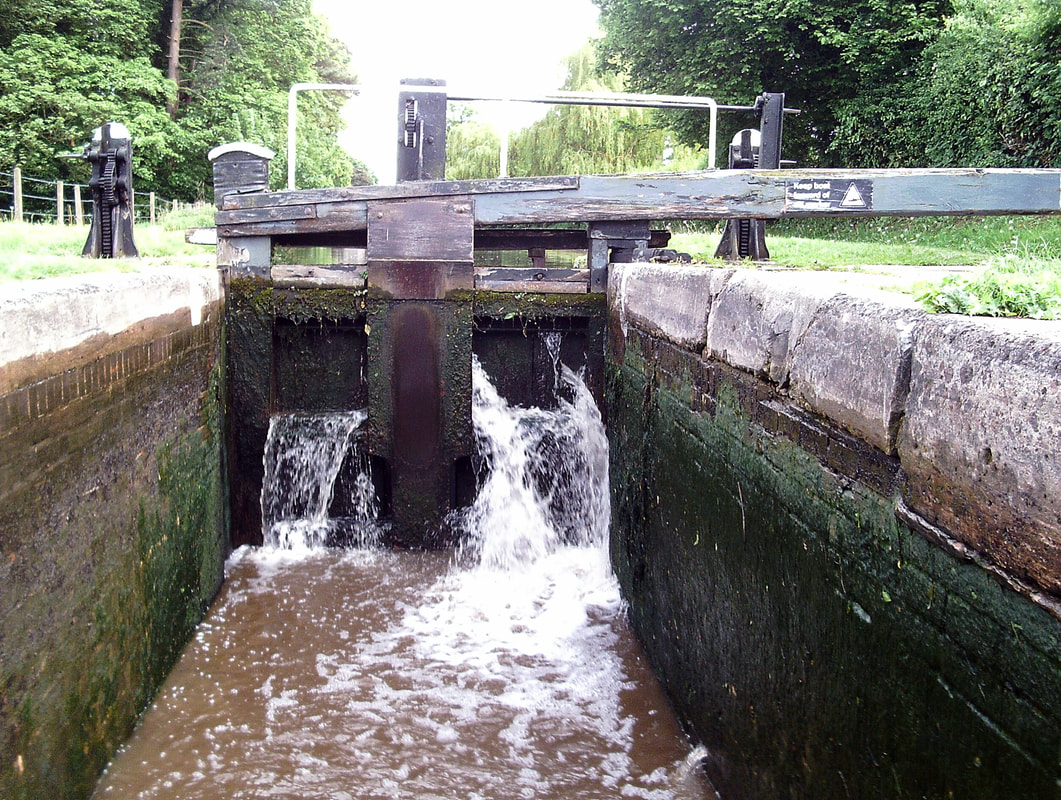
Photos: (1st) The claim, (2nd) The explanation, (3rd) The reality.